Data Analysis with Excel | Final Quiz
Quiz Summary
0 of 9 Questions completed
Questions:
Information
You have already completed the quiz before. Hence you can not start it again.
Quiz is loading…
You must sign in or sign up to start the quiz.
You must first complete the following:
Results
Results
0 of 9 Questions answered correctly
Your time:
Time has elapsed
You have reached 0 of 0 point(s), (0)
Earned Point(s): 0 of 0, (0)
0 Essay(s) Pending (Possible Point(s): 0)
Categories
- Not categorized 0%
- 1
- 2
- 3
- 4
- 5
- 6
- 7
- 8
- 9
- Current
- Review
- Answered
- Correct
- Incorrect
-
Question 1 of 9
1. Question
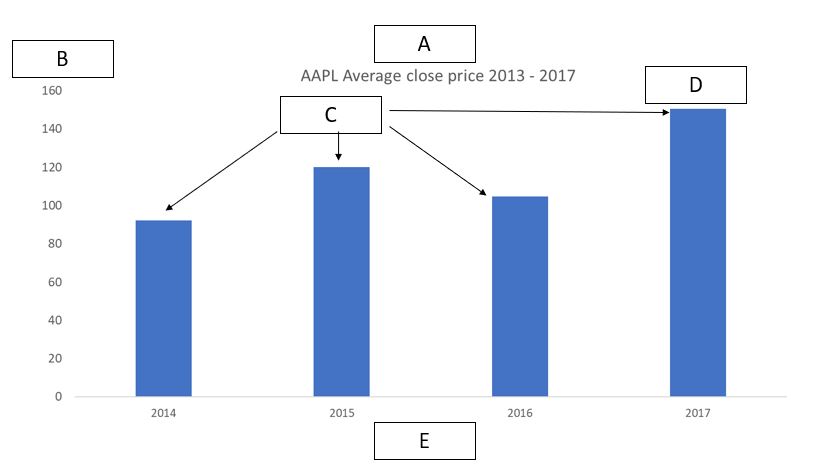
Match the correct graph components to label names:
Sort elements
- Chart title
- Y axis
- Data series
- Data point
- X axis
-
A
-
B
-
C
-
D
-
E
CorrectIncorrect -
Question 2 of 9
2. Question
Drag the components of the VLOOKUP formula into the right order
-
= VLOOKUP
-
Table 2 range
-
Table 1 common field
-
Table 2 column to return
-
Exact or approximate match
View Answers:
CorrectIncorrect -
-
Question 3 of 9
3. Question
Select the formula combinations that you could use to return the text ‘suburb’ from this text value – ‘street-suburb.zipcode’
CorrectIncorrect -
Question 4 of 9
4. Question
Using the quiz dataset.
Calculate the skew for each numerical field. Which field in the dataset is highly right-skewed?
CorrectIncorrect -
Question 5 of 9
5. Question
Using the quiz dataset.
Calculate the interquartile ranges of the ‘Open’, ‘high’,’low’, ‘close’ and ‘volume’ fields.
Match the correct values:
Sort elements
- 42.16
- 42.29
- 41.49
- 42.02
- 39042308
-
Open
-
high
-
low
-
close
-
volume
CorrectIncorrect -
Question 6 of 9
6. Question
Using the quiz dataset (Apple stock data 13-17)
How many values in the ‘close’ field fall above or below 3 STD Deviations from the average.
CorrectIncorrect -
Question 7 of 9
7. Question
Using the quiz dataset.
Create a pivot table to calculate Apple’s average stock price per year.
Match the correct answers below:
Sort elements
- 67.24
- 92.26
- 120.04
- 104.60
- 150.59
-
2013
-
2014
-
2015
-
2016
-
2017
CorrectIncorrect -
Question 8 of 9
8. Question
Using the quiz dataset.
Create a pivot table that calculates the percentage increase/decrease of Apple’s average closing stock prices by year.
Match the correct answers below:
Sort elements
- 37.22%
- 30.10%
- -12.86%
- 43.96%
-
2013 to 2014
-
2014 to 2015
-
2015 to 2016
-
2016 to 2017
CorrectIncorrect -
Question 9 of 9
9. Question
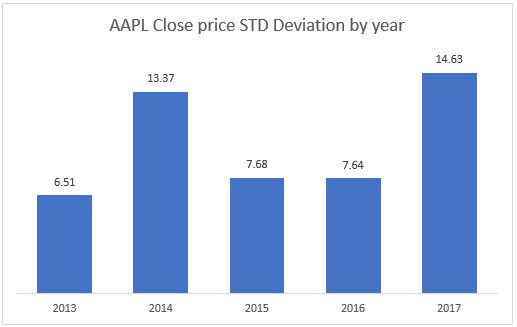
Does this graph accurately reflect the STD Deviation of AAPL’s closing price by year?
Use a pivot table to check
CorrectIncorrect